
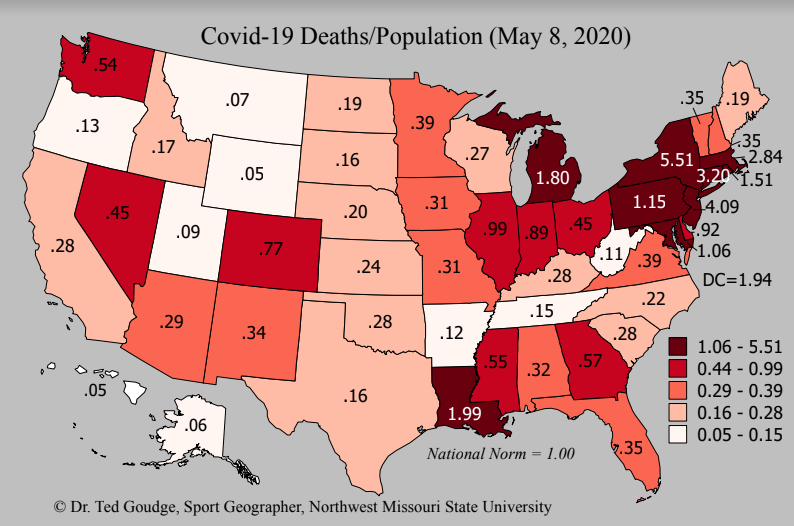
 “This week’s Covid-19 map, based on the Johns Hopkins (CSSE) data displays the number of deaths in each state divided by the population (deaths per capita). The pattern is very similar to previous maps. The ten states in the highest category, account for 72% of the deaths. Eight, in the Northeast, are responsible for 64% of the country’s deaths. Midwest and Upper Plains states remain low but have increased in recent weeks. The average number of deaths/cases is 2.61% in these states compared to 6.02% for the nation and 6.98% for the world.”


Facebook Comments