
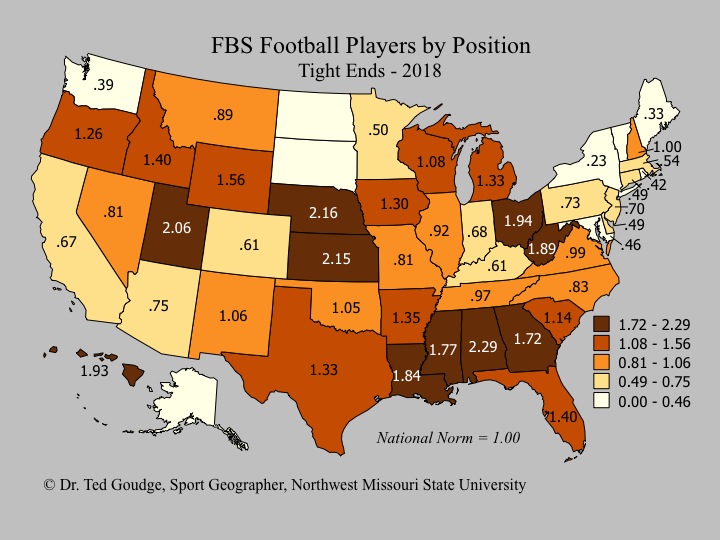
This football player position production map, based on 713 tight ends, is more balanced throughout the nation with a top value of 2.29. 23 states have a per-capita value over the national norm of 1.00. The heartland (Midwest) is more pronounced along with the South that dominated overall player production. Five states failed to produce any tight ends. Nine were from outside the country.


Facebook Comments