
 Two months ago, based on the Johns Hopkins (CSSE) data, this map displayed the number of deaths in each state divided by the population, deaths per capita. Only seven states were above the national average. They accounted for 73 percent of the deaths. New York was the epicenter and it alone accounted for 45 percent of the country’s deaths. The pattern is very similar to the most current map. The big difference is how extreme the numbers were: New York was 7.11 and is now 4.14 and how Missouri has slowly gone from .27 to .42 and Iowa likewise from .18 to .58.
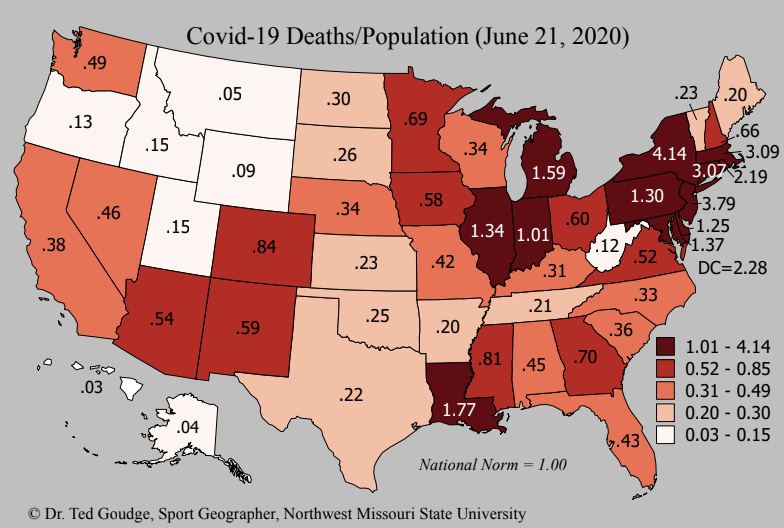 This indicates the spread of COVID-19 has gone over the past two months from being a very regional phenomena to much more national in scope. I believe this pattern will continue it’s slow march throughout the country perhaps taking months to complete. The states in the highest category, account for 72 percent of the deaths. Midwest and Upper Plains states remain low but continue their gradual increase as the virus becomes more national in scope. The average number of deaths/cases is 2.40 percent in these states compared to 5.26 percent for the nation and 5.22 percent for the world.


Facebook Comments