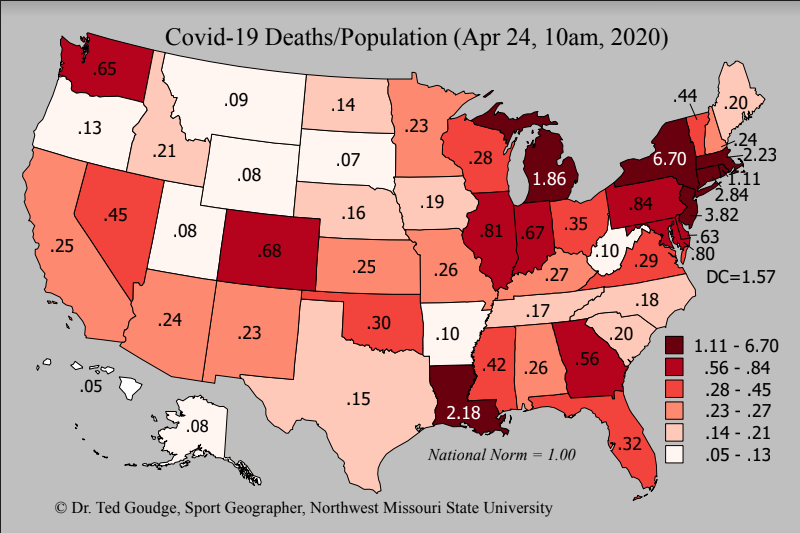
 “This week’s Covid-19 map, based on the Johns Hopkins (CSSE) data displays the number of deaths in each state divided by the population (deaths per capita). The pattern is very similar to last week’s map. Only eight states are above the national average, accounting for 76% of the deaths. Five, in the Northeast, are responsible for 61% of the country’s deaths. Midwest and Upper Plains states remain on the lower side. The average number of deaths/cases is 2.76% in these states compared to 5.74% for the nation and 7.03% for the world.”


Facebook Comments